



Funders ask a version of the same question every time. What does a dollar buy?
For years the honest answer from most education technology companies has been a shrug dressed up as a chart. We show engagement minutes, download counts, and a warm quote from a teacher. None of it answers the question, because none of it can be set beside the other twenty proposals on the same desk.
So this is an uncomfortable piece of writing. I want to put our work on the same axis as everything else a funder could buy, then stop where our evidence stops.
The One Number Funders Actually Use
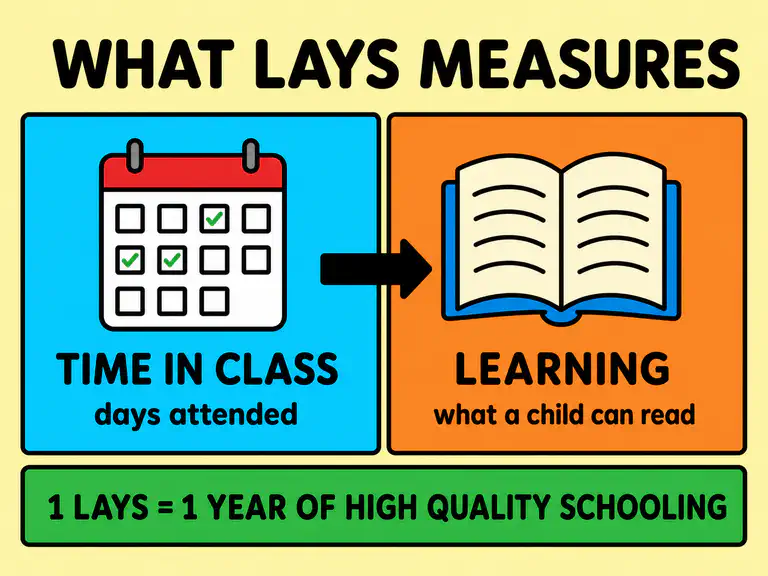
That axis is called LAYS, short for learning adjusted years of schooling. One LAYS is a year of school in a very high-performing system, counted by what a child actually learns rather than by how long they sat in a classroom.
Divide the learning gain by the money spent and you get LAYS per $100. It is a cost per learning outcome that works for tutoring, textbooks, radio, and apps alike.
Noam Angrist and colleagues converted 150 impact evaluations from 46 countries onto that single scale (Angrist et al., 2020, World Bank Policy Research Working Paper 9450). Two of their findings should shape how anyone reads an edtech pitch.
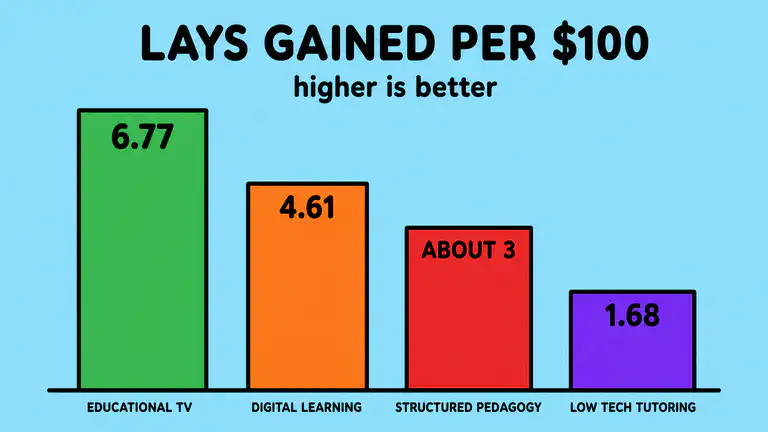
First, more than half of the interventions they reviewed had null effects, meaning no measurable learning gain at all. Second, the best performers are remarkable. Targeting instruction to a child’s actual level, and structured pedagogy, meaning teachers working from structured lesson plans with linked materials and monitoring, each returned around 3 additional LAYS per $100 on average. That is the bar.
Where EdTech Actually Lands
EdTech Hub has since run the same arithmetic on technology programs. A 2025 resource deck by Joel Mitchell puts three Kenyan studies in one table: digital personalized learning in pre-primary classrooms (EIDU) at 4.61 LAYS per $100 and $6.88 per child, low-tech personalized learning for girls (mShule) at 1.68 LAYS per $100 and $10.79 per child, and educational television at 6.77 LAYS per $100 and $1.67 per child (Mitchell, 2025).
Read the cost column twice. Television leads not because it teaches best, but because it is cheap. The effectiveness of technology in education is only half the fraction, and the denominator does as much work as the numerator.
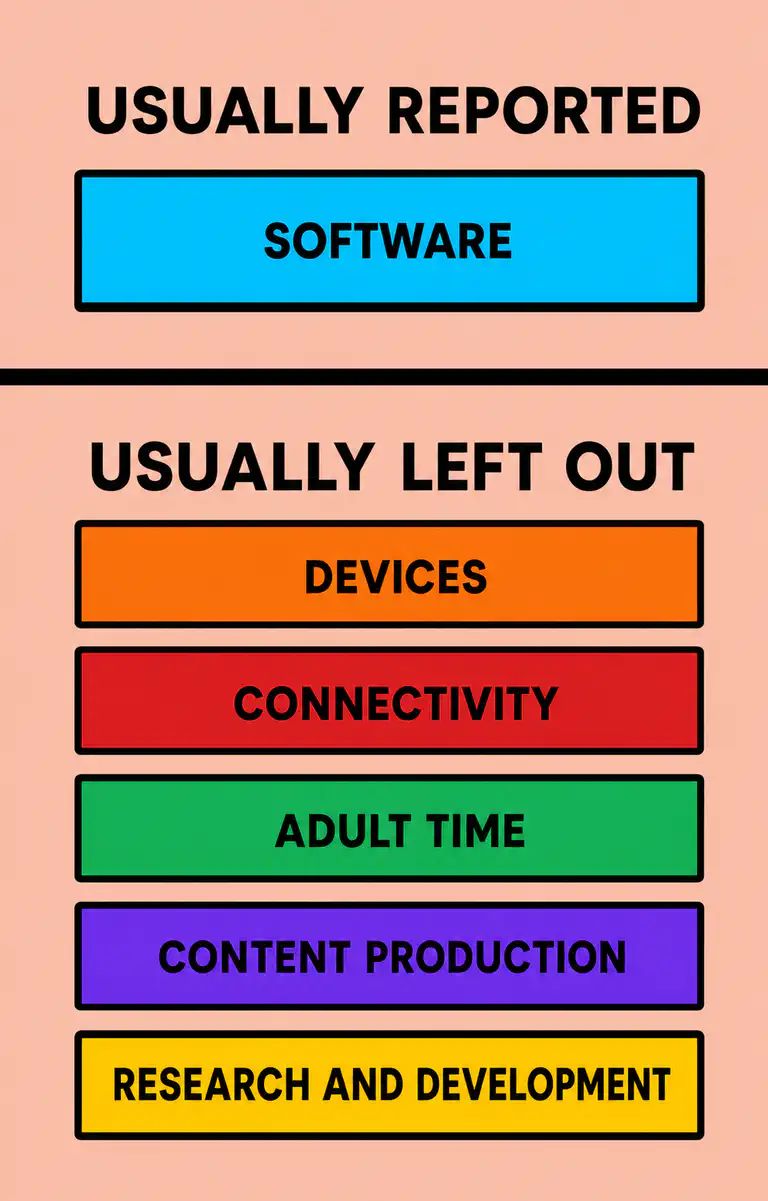
Mitchell’s deck also names the problem under the floorboards. Among the pressing problems in edtech cost-effectiveness analysis, it lists “widespread and significant underreporting of actual costs”, including the failure to reconcile budgets with money actually spent and to count externalities such as infrastructure (Mitchell, 2025).
Even careful work meets this problem. De Simone and colleagues ran a six-week randomized trial of an AI tutor in Nigeria, assigning secondary students by chance to the program or to their normal lessons, 657 of them to the program (De Simone et al., 2025, World Bank Policy Research Working Paper 11125). The pilot cost about $48 per pupil, with a marginal cost, the cost of adding one more student, of $9. It returned between 0.6 and 1.9 LAYS per $100. The note beneath their cost table says electricity and school infrastructure costs are not included.
I am not scoring a point off them. They disclosed it, and disclosure is what makes a number usable to somebody deciding where the next million goes.
What This Means for Our Own Numbers
When I review the research on cost effectiveness, the pattern is not that edtech performs badly. It is that the numbers are rarely built the same way twice, so they cannot be stacked against each other.
At Bookbot I analyze reading data from thousands of children, working on a structured reading program paired with speech recognition that listens while a child reads aloud and answers immediately. Its cost profile is one a funder can inspect, and it is not the profile of a human tutoring program.
Bookbot does not have a cost-per-LAYS figure yet. That calculation needs a measured learning gain, and ours will come from our efficacy trial in South Africa. We expect to publish ours at the beginning of 2028.
What an Honest Cost Line Has to Include
- Count the device, not just the software. Tablets, chargers, and replacements are amortized, meaning spread across the years the hardware actually survives in a classroom.
- Count connectivity, or the cost of avoiding it. Bookbot is built to work in low-connectivity settings, which shifts that cost from data plans into engineering rather than erasing it.
- Count adult time. Teacher and facilitator hours are a real cost even when nobody invoices for them, and leaving them out flatters every school-based program.
- Count content production. In the Nigerian pilot, fixed costs were 43% of the total and content development was 72% of those fixed costs (De Simone et al., 2025). Leveled decodable books are not free either.
- Amortize research and development. Model training, speech recognition work, and evaluation design are money spent before the first child reads a word.
- Use paid costs, not budgeted ones. EdTech Hub’s good practice rests on capturing what was actually spent rather than what was forecast (Mitchell, 2025).
- Publish the provenance of the denominator. Say which costs were excluded and why, the way the Nigeria team did, so a reader can adjust rather than guess.
Being Willing to Be Measured
The market makes this cheap to say and rare to do. The Gates Foundation and ADQ partnership announcement of 17 December 2025 reports that more than 93% of edtech products in low- and middle-income countries are not tested for proof-of-learning impact.
The stakes behind that gap are not abstract. The most recent global estimate puts 70% of 10-year-olds in low- and middle-income countries unable to read and understand a simple written text (World Bank et al., 2022).
A cost benefit analysis in education goes further and converts learning into projected earnings, which is how the Nigeria team reached their benefit-cost ratio. I prefer the education units. LAYS per $100 keeps the argument about children reading rather than about discount rates.
We will work out the full costs when our South Africa trial results arrive, and publish them at the beginning of 2028.
References
Angrist, N., Evans, D. K., Filmer, D., Glennerster, R., Rogers, F. H., & Sabarwal, S. (2020). How to improve education outcomes most efficiently? A comparison of 150 interventions using the new learning-adjusted years of schooling metric (Policy Research Working Paper No. 9450). World Bank. https://documents1.worldbank.org/curated/en/801901603314530125/pdf/How-to-Improve-Education-Outcomes-Most-Efficiently-A-Comparison-of-150-Interventions-Using-the-New-Learning-Adjusted-Years-of-Schooling-Metric.pdf
De Simone, M. E., Tiberti, F. H., Barron Rodriguez, M. R., Manolio, F. A., Mosuro, W., & Dikoru, E. J. (2025). From chalkboards to chatbots: Evaluating the impact of generative AI on learning outcomes in Nigeria (Policy Research Working Paper No. 11125). World Bank. https://documents.worldbank.org/curated/en/099548105192529324/pdf/IDU-c09f40d8-9ff8-42dc-b315-591157499be7.pdf
Gates Foundation. (2025, December 17). ADQ and Gates Foundation announce groundbreaking partnership to leverage responsible AI and EdTech to transform foundational learning outcomes [Press release]. https://www.gatesfoundation.org/ideas/media-center/press-releases/2025/12/education-systems-partnership
Mitchell, J. (2025). Cost-effective EdTech: A resource deck that summarises EdTech Hub’s work to improve cost-effectiveness analysis in EdTech [Presentation]. EdTech Hub. https://doi.org/10.53832/edtechhub.1158
World Bank, UNESCO, UNICEF, UK Foreign, Commonwealth & Development Office, USAID, & Bill & Melinda Gates Foundation. (2022). The state of global learning poverty: 2022 update. World Bank. https://thedocs.worldbank.org/en/doc/e52f55322528903b27f1b7e61238e416-0200022022/original/Learning-poverty-report-2022-06-21-final-V7-0-conferenceEdition.pdf